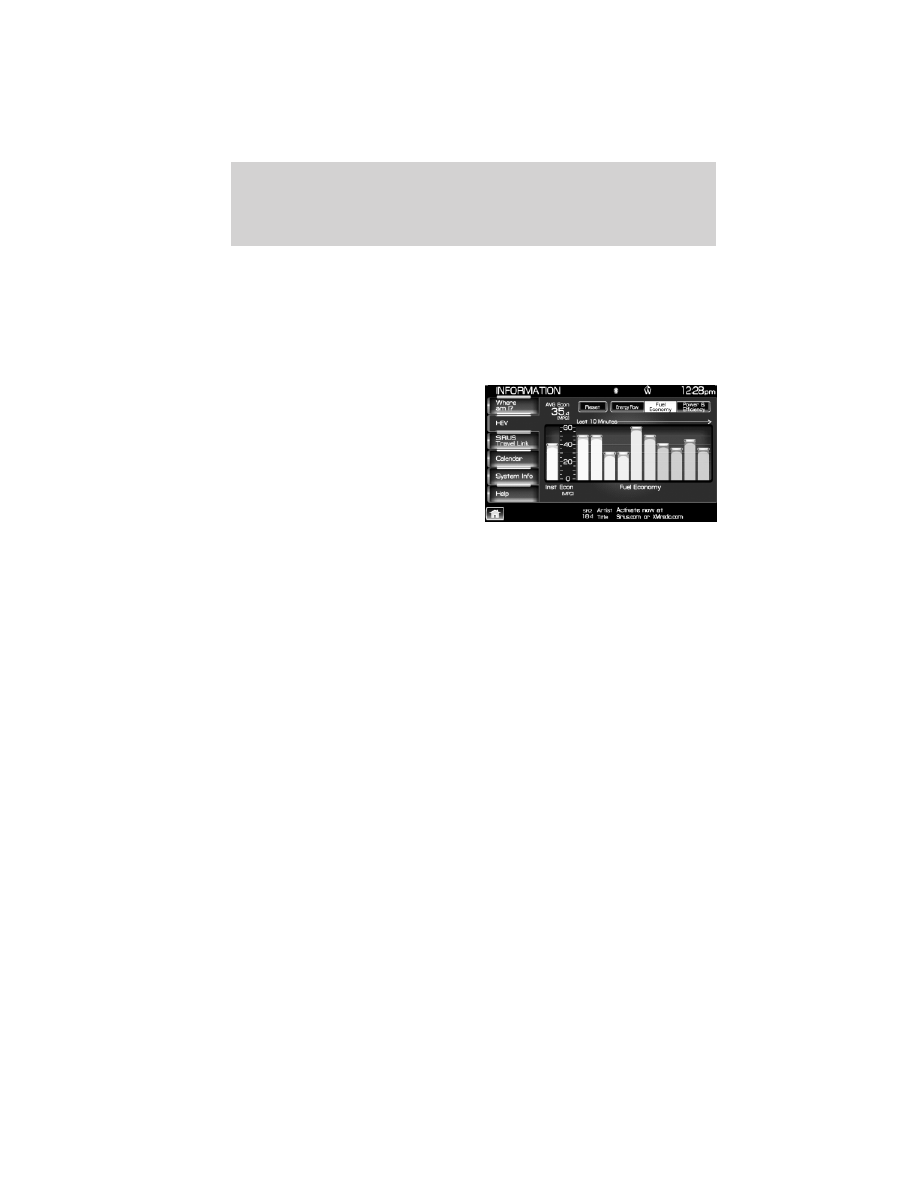
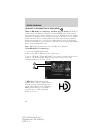
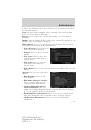
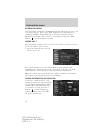
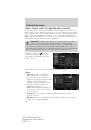
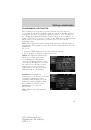
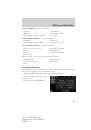
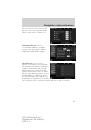
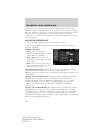
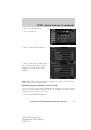
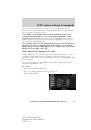
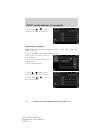
FUEL ECONOMY SCREEN
If you have a Fusion Hybrid or MKZ Hybrid, the fuel economy screen
displays instantaneous fuel consumption, overall average fuel economy
and also a graph of fuel economy achieved in the last 10, 20 or
60 minutes of driving. (Refer to Average Fuel Economy in the
Instrument Cluster chapter in your Owner’s Guide.) To view this screen,
select ‘Show Fuel Economy’ on the ‘HEV’ tab screen.
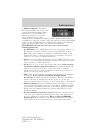
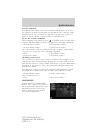
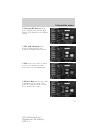
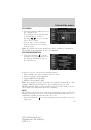
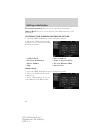
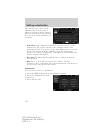
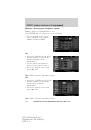
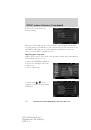
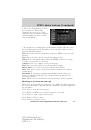
If you have an Escape Hybrid, the
fuel economy screen will display fuel
economy achieved in the last
10 minutes of driving. (Refer to
Average Fuel Economy in the
Instrument Cluster chapter in your
Owner’s Guide.) To view this screen,
select ’Fuel Economy’ on the ‘HEV’
tab screen.
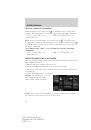
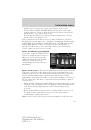
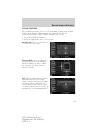
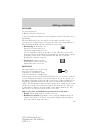
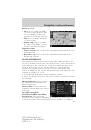
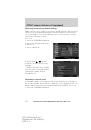
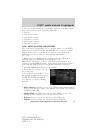
•
Instantaneous Fuel Economy (Inst Econ):
This is displayed on
the vertical bar on the left of the screen ranging from 0–60 mpg.
When the vehicle is not moving, the Ins Econ function will display no
bar on the Inst Cons graph indicating 0 mpg. Conversely, if you are
driving in electric mode (engine off), this function will display 60+
mpg. Instantaneous Economy cannot be reset.
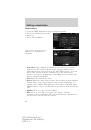
•
Overall Average Fuel Economy (AVG MPG):
The AVG MPG is
displayed on the upper left hand corner of the screen. The AVG MPG
will be retained when the key is turned off and will continue averaging
when driving resumes. Pressing RESET will reset the AVG MPG to
zero. This will also reset the Average Fuel Economy on the Instrument
Cluster.
Note:
If you have an Escape Hybrid, the average fuel economy
information will not appear in the instrument cluster.
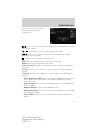
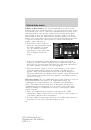
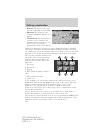
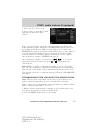
•
Fuel Economy History graph:
Depending on your vehicle, this
graph will indicate average fuel economy in 10, 20 or 60 minute
intervals. If you have a Fusion Hybrid or MKZ Hybrid, you can choose
the interval using the message center. If you have an Escape Hybrid,
the display will appear in 10 minute intervals. The graph is updated
each minute with the fuel economy that was achieved during the prior
10, 20 or 60 minutes of driving. Each new average will be added to the
left side of the graph, shifting the past data to the right. When the
graph area is full, the right most point will be deleted, keeping a
Information menu
78
2012 Centerstack
(ng1)
Supplement, 3rd Printing
USA
(fus)
 1
1
 2
2
 3
3
 4
4
 5
5
 6
6
 7
7
 8
8
 9
9
 10
10
 11
11
 12
12
 13
13
 14
14
 15
15
 16
16
 17
17
 18
18
 19
19
 20
20
 21
21
 22
22
 23
23
 24
24
 25
25
 26
26
 27
27
 28
28
 29
29
 30
30
 31
31
 32
32
 33
33
 34
34
 35
35
 36
36
 37
37
 38
38
 39
39
 40
40
 41
41
 42
42
 43
43
 44
44
 45
45
 46
46
 47
47
 48
48
 49
49
 50
50
 51
51
 52
52
 53
53
 54
54
 55
55
 56
56
 57
57
 58
58
 59
59
 60
60
 61
61
 62
62
 63
63
 64
64
 65
65
 66
66
 67
67
 68
68
 69
69
 70
70
 71
71
 72
72
 73
73
 74
74
 75
75
 76
76
 77
77
 78
78
 79
79
 80
80
 81
81
 82
82
 83
83
 84
84
 85
85
 86
86
 87
87
 88
88
 89
89
 90
90
 91
91
 92
92
 93
93
 94
94
 95
95
 96
96
 97
97
 98
98
 99
99
 100
100
 101
101
 102
102
 103
103
 104
104
 105
105
 106
106
 107
107
 108
108
 109
109
 110
110
 111
111
 112
112
 113
113
 114
114
 115
115
 116
116
 117
117
 118
118
 119
119
 120
120
 121
121
 122
122
 123
123
 124
124
 125
125
 126
126
 127
127
 128
128
 129
129
 130
130
 131
131
 132
132
 133
133
 134
134
 135
135
 136
136
 137
137
 138
138
 139
139
 140
140
 141
141
 142
142
 143
143
 144
144
 145
145
 146
146
 147
147
 148
148
 149
149
 150
150
 151
151
 152
152
 153
153
 154
154
 155
155
 156
156
 157
157
 158
158
 159
159
 160
160
 161
161
 162
162
 163
163
 164
164
 165
165
 166
166
 167
167
 168
168
 169
169
 170
170
 171
171
 172
172
 173
173
 174
174
 175
175
 176
176
 177
177
 178
178
 179
179
 180
180
 181
181
 182
182
 183
183
 184
184
 185
185
 186
186
 187
187
 188
188
 189
189
 190
190
 191
191
 192
192
 193
193
 194
194
 195
195
 196
196
 197
197
 198
198
 199
199
 200
200