28
Before Using Your Camera
1
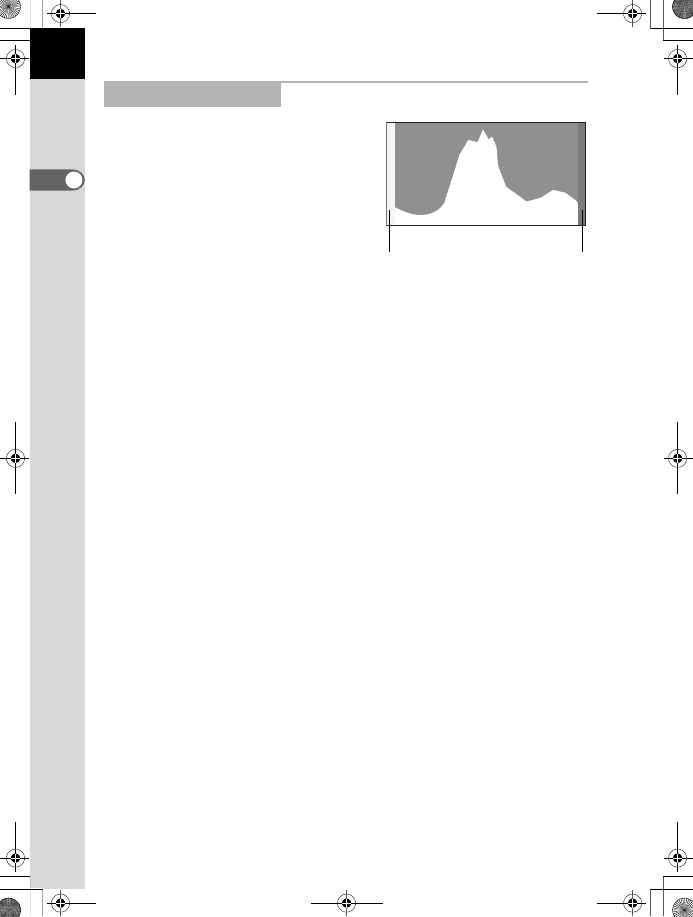
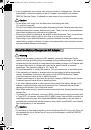
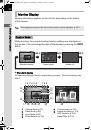
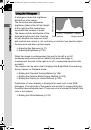
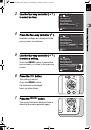
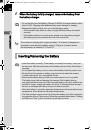
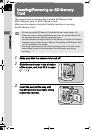
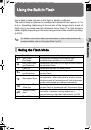
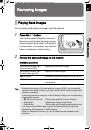
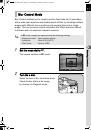
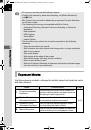
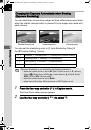
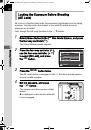
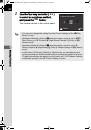
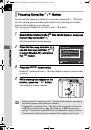
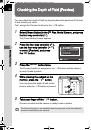
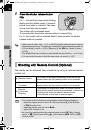
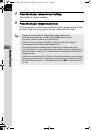
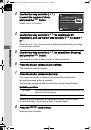
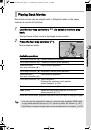
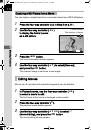
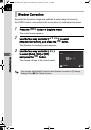
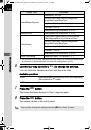
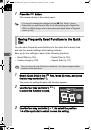
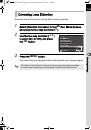
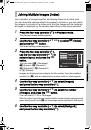
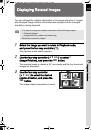
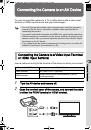
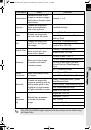
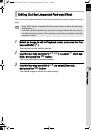
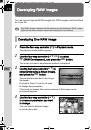
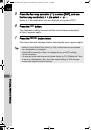
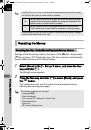
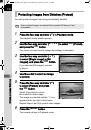
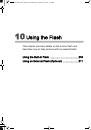
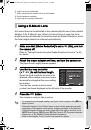
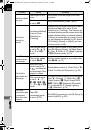
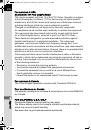
A histogram shows the brightness
distribution of an image.
The horizontal axis represents
brightness (dark at the left and bright
at the right) and the vertical axis
represents the number of pixels.
The shape and the distribution of the
histogram before and after shooting
tell you whether the exposure level
and contrast are correct or not, and lets you decide if you need to adjust
the exposure and take a picture again.
When the image is underexposed, the part to the left is cut off
(underexposed portions with no detail) and when the image is
overexposed, the part to the right is cut off (overexposed portions with
no detail).
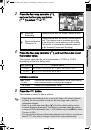
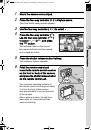
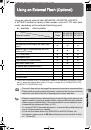
This camera can be set so that it displays the Bright/Dark Area warning
during Capture or Playback mode.
Setting the Playback Display Method (p.148)
Setting the Capture Mode Display Method (p.185)
Setting the Display for Instant Review (p.186)
Distribution of color intensity is displayed for each color in the RGB
histogram. The right side of the graphs look similar for images that have
the white balance adjusted well. If only one color is lopsided to the left, that
color is too intense.
Setting the White Balance (p.120)
Using the Histogram
Nu
m
be
r o
f pi
xe
ls
→
Dark portions
Bright portions
(Dark)
←
Brightness
→
(Bright)
e_kb535_ENG.book Page 28 Wednesday, October 10, 2012 3:03 PM
 1
1
 2
2
 3
3
 4
4
 5
5
 6
6
 7
7
 8
8
 9
9
 10
10
 11
11
 12
12
 13
13
 14
14
 15
15
 16
16
 17
17
 18
18
 19
19
 20
20
 21
21
 22
22
 23
23
 24
24
 25
25
 26
26
 27
27
 28
28
 29
29
 30
30
 31
31
 32
32
 33
33
 34
34
 35
35
 36
36
 37
37
 38
38
 39
39
 40
40
 41
41
 42
42
 43
43
 44
44
 45
45
 46
46
 47
47
 48
48
 49
49
 50
50
 51
51
 52
52
 53
53
 54
54
 55
55
 56
56
 57
57
 58
58
 59
59
 60
60
 61
61
 62
62
 63
63
 64
64
 65
65
 66
66
 67
67
 68
68
 69
69
 70
70
 71
71
 72
72
 73
73
 74
74
 75
75
 76
76
 77
77
 78
78
 79
79
 80
80
 81
81
 82
82
 83
83
 84
84
 85
85
 86
86
 87
87
 88
88
 89
89
 90
90
 91
91
 92
92
 93
93
 94
94
 95
95
 96
96
 97
97
 98
98
 99
99
 100
100
 101
101
 102
102
 103
103
 104
104
 105
105
 106
106
 107
107
 108
108
 109
109
 110
110
 111
111
 112
112
 113
113
 114
114
 115
115
 116
116
 117
117
 118
118
 119
119
 120
120
 121
121
 122
122
 123
123
 124
124
 125
125
 126
126
 127
127
 128
128
 129
129
 130
130
 131
131
 132
132
 133
133
 134
134
 135
135
 136
136
 137
137
 138
138
 139
139
 140
140
 141
141
 142
142
 143
143
 144
144
 145
145
 146
146
 147
147
 148
148
 149
149
 150
150
 151
151
 152
152
 153
153
 154
154
 155
155
 156
156
 157
157
 158
158
 159
159
 160
160
 161
161
 162
162
 163
163
 164
164
 165
165
 166
166
 167
167
 168
168
 169
169
 170
170
 171
171
 172
172
 173
173
 174
174
 175
175
 176
176
 177
177
 178
178
 179
179
 180
180
 181
181
 182
182
 183
183
 184
184
 185
185
 186
186
 187
187
 188
188
 189
189
 190
190
 191
191
 192
192
 193
193
 194
194
 195
195
 196
196
 197
197
 198
198
 199
199
 200
200
 201
201
 202
202
 203
203
 204
204
 205
205
 206
206
 207
207
 208
208
 209
209
 210
210
 211
211
 212
212
 213
213
 214
214
 215
215
 216
216
 217
217
 218
218
 219
219
 220
220
 221
221
 222
222
 223
223
 224
224
 225
225
 226
226
 227
227
 228
228
 229
229
 230
230
 231
231
 232
232
 233
233
 234
234
 235
235
 236
236
 237
237
 238
238
 239
239
 240
240
 241
241
 242
242
 243
243
 244
244
 245
245
 246
246
 247
247
 248
248
 249
249
 250
250