13
iNUKE NU6000DSP/NU3000DSP/NU1000DSP User Manual
•
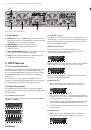
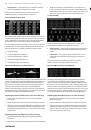
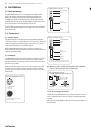
Frequency Curve
—displays the filter curves in visual form, and allows
click-and-drag manipulation of EQ frequencies and gain.
The Frequency Curve and Control View interact with each other and
simultaneously shift as you change parameters in either view.
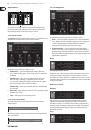
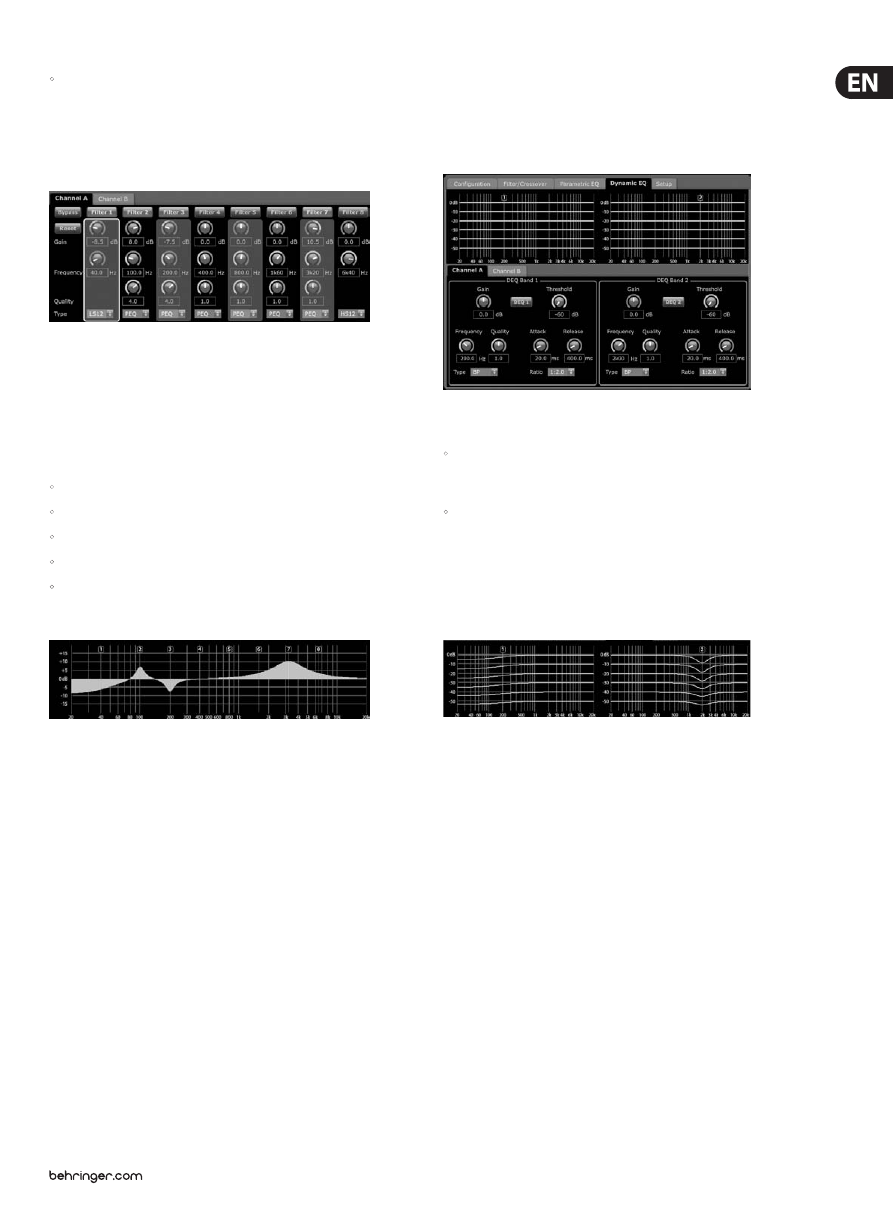
Parametric EQ Control View
The Control View of the Parametric EQ tab contains virtual knob controls for Gain,
Frequency, Quality (parametric EQ only). Exact parameter values appear in boxes
below each virtual knob. These parameters may be altered by either adjusting
the virtual knobs or by entering values directly in the parameter boxes.
To activate an EQ band, click the button (Filter 1, Filter 2, and so on) at the top of
each channel strip. The channel button will light up to indicate the EQ is active.
Pull-down Type menus for each EQ band contain these additional options:
•
PEQ (parametric EQ)
•
LS6 (low shelving EQ, with a 6 dB slope)
•
LS12 (low shelving EQ, with a 12 dB slope)
•
HS6 (high shelving EQ, with a 6 dB slope)
•
HS12 (high shelving EQ, with a 12 dB slope)
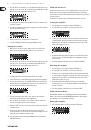
Parametric EQ Frequency Curve Display
The Frequency Curve displays a frequency range from 20 Hz to 20 kHz, with 15 dB
of cut/boost displayed on the vertical axis. Within this graphic field, the EQ curve
appears as a solid fill above and below the 0 dB center line and running from
left to right. The curve shifts and moves to reflect changing parameter values.
Dotted vertical lines indicate frequency points for the various EQ bands,
numbered 1 through 8, and these frequency points can be selected and moved
through the frequency spectrum using the mouse or trackpad. The gain for each
EQ band may also be adjusted by using the frequency lines.
Adjusting Parametric EQ frequency via click-and-drag
1. Click and hold on the numbered box at the top of the desired EQ band
frequency line.
2. Drag the frequency line to the desired location on the frequency spectrum.
3. The EQ curve shown by the solid yellow fill will move and adjust as you shift
the frequency line. The virtual knob and frequency displayed in the Control
View will also simultaneously change as you move the frequency line in the
Frequency Curve.
Adjusting Parametric EQ gain via click-and-drag
1. Click and hold over the numbered box at the top of the desired EQ band’s
frequency line.
2. Move the cursor vertically up or down the frequency line to the desired gain level.
3. The EQ curve shown by the solid yellow fill will re-size and adjust as you
move the cursor up and down the frequency line. The virtual gain knob and
gain dB displayed in the Control View will also simultaneously change as you
move the cursor up and down frequency line in the Frequency Curve.
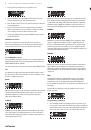
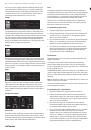
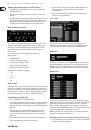
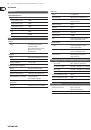
4. Dynamic EQ
The Dynamic EQ tab displays and controls DEQ DSP module settings in two
formats (similar to the Filter/Crossover and Parametric EQ tabs):
•
Frequency Curve
—displays the layered dynamic EQ curves in visual form,
and allows click-and-drag manipulation of dynamic EQ/filter frequencies
and gain.
•
Control View
—allows parameter tweaks via virtual controls, as well
as pull-down menus for EQ/filter type (Type) and gain reduction/boost
ratio (Ratio).
The Frequency Curve and Control View interact with each other and
simultaneously shift as you change parameters in either view.
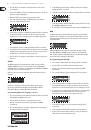
Dynamic EQ Frequency Curve Display
The Frequency Curve displays a frequency range from 20 Hz to 20 kHz, with
layered dynamic EQ curves. Within this graphic field, the dynamic EQ curves
appear as solid yellow lines that appear at every 10 dB (0 to -50 dB) threshold on
the vertical axis. The curves shift and move to reflect changing parameter values.
Dotted vertical lines indicate frequency points for the various dynamic EQ bands,
numbered 1 and 2 (per channel), and these frequency points can be selected and
moved through the frequency spectrum using the mouse or trackpad. The gain
for each dynamic EQ band may also be adjusted by using the frequency lines.
Adjusting dynamic EQ frequency via click-and-drag
1. Click and hold on the numbered box at the top of the desired dynamic
EQ band frequency line.
2. Drag the frequency line to the desired location on the frequency spectrum.
3. The layered dynamic EQ curves shown by the layered yellow lines will move
and adjust as you shift the frequency line. The virtual knob and frequency
displayed in the Control View will also simultaneously change as you move
the frequency line in the Frequency Curve.