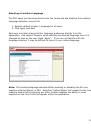
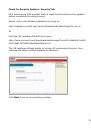
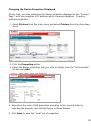
98
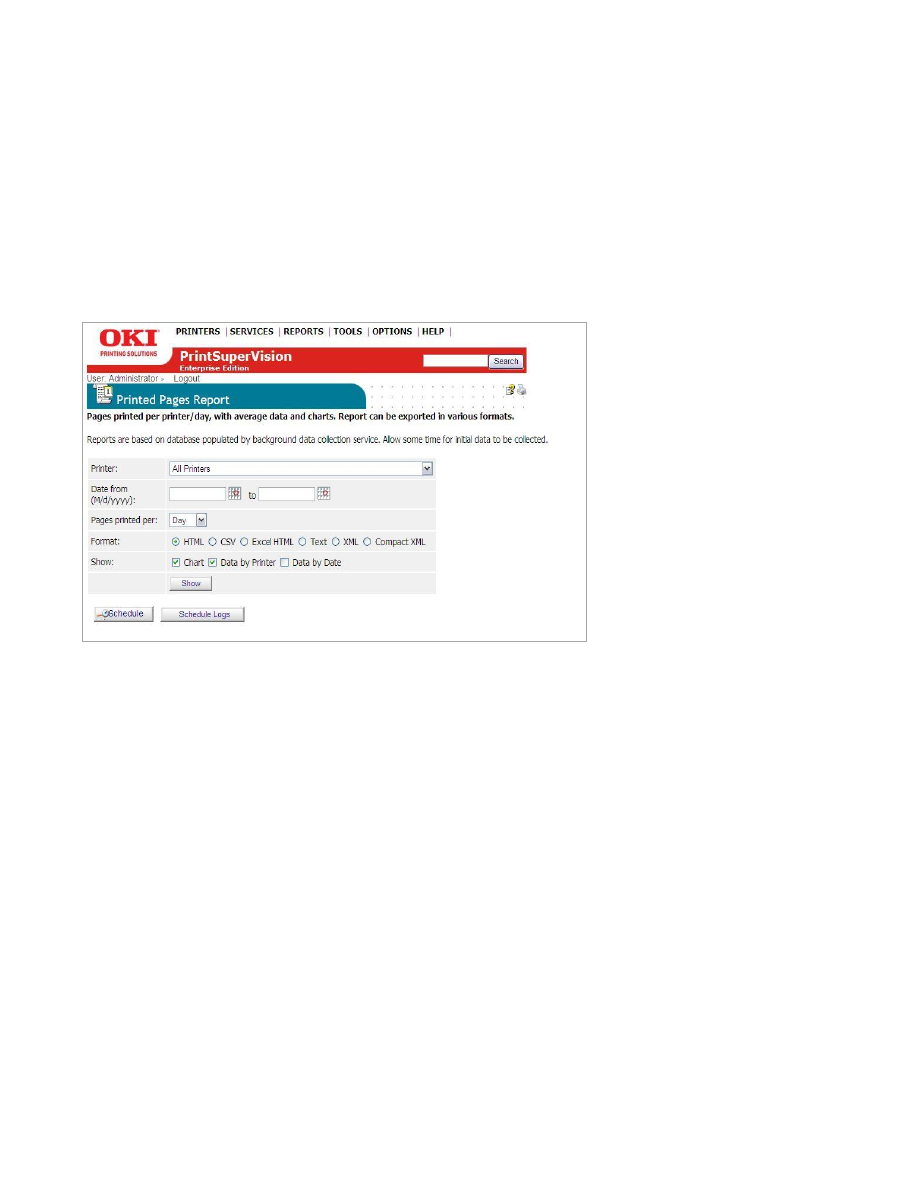
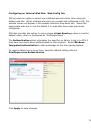
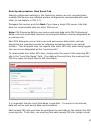
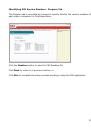
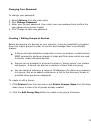
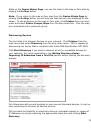
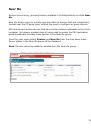
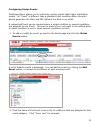
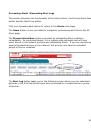
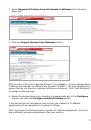
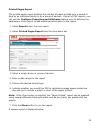
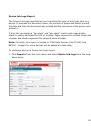
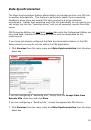
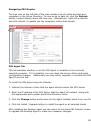
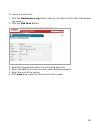
Printed Pages Report
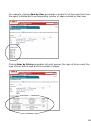
The printed pages report displays the number of pages printed over a period of
time by an individual device or by a group of devices. Like all of PSV reports, you
can use the
Configure Properties and Attributes
feature prior to defining the
parameters of the report to add additional information to the report.
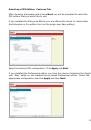
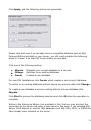
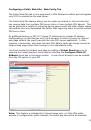
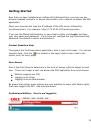
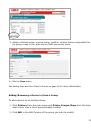
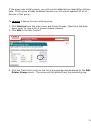
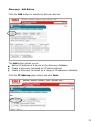
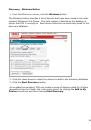
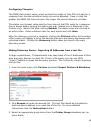
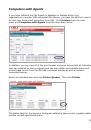
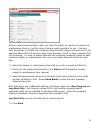
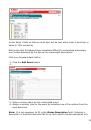
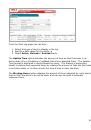
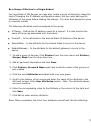
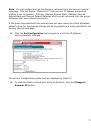
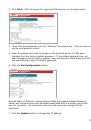
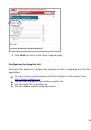
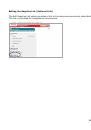
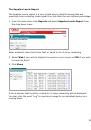
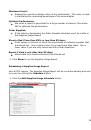
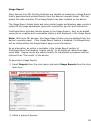
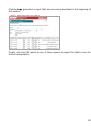
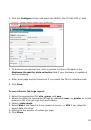
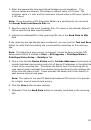
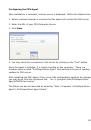
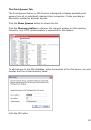
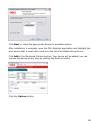
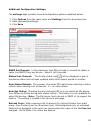
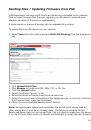
1.
Select
Reports
from the main menu
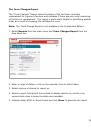
2.
Select
Printed Pages Report
from the drop down box
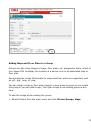
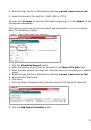
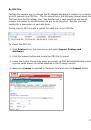
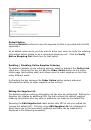
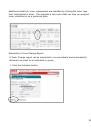
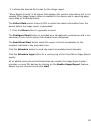
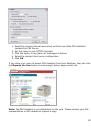
3.
Select a single device or group of devices
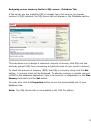
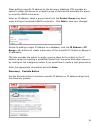
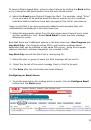
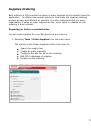
4.
Enter a date range for the report
5.
Choose the desired format type
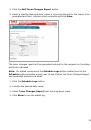
6.
Indicate whether you would like PSV to calculate average pages printed per
day and /or to include a graph or chart of the pages printed.
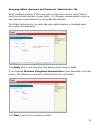
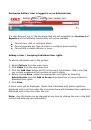
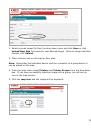
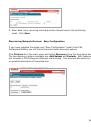
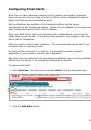
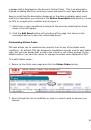
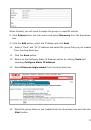
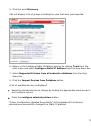
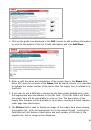
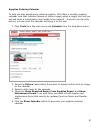
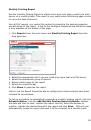
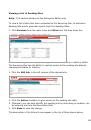
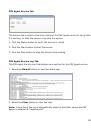
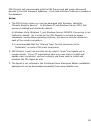
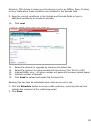
Note:
If the Chart option is selected, t
he “P
ages Printed
”
report can be graphed
using several different charting formats such as pie charts, bar graphs and line
graphs.
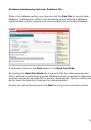
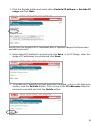
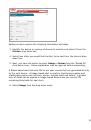
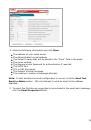
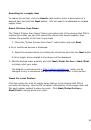
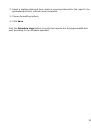
7.
Click the
Show
button to run the report.
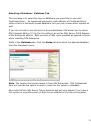
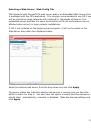
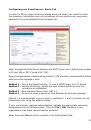
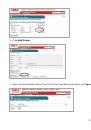
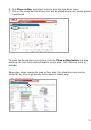
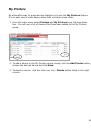
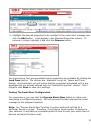
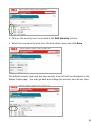
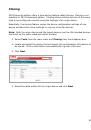
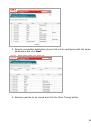
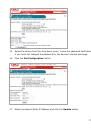
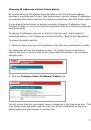
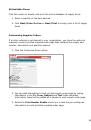
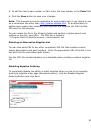
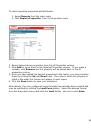
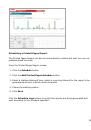
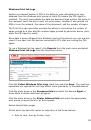
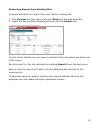
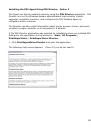
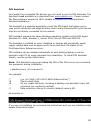
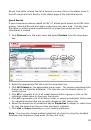
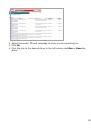
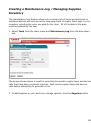
A sample report is displayed below.
 1
1
 2
2
 3
3
 4
4
 5
5
 6
6
 7
7
 8
8
 9
9
 10
10
 11
11
 12
12
 13
13
 14
14
 15
15
 16
16
 17
17
 18
18
 19
19
 20
20
 21
21
 22
22
 23
23
 24
24
 25
25
 26
26
 27
27
 28
28
 29
29
 30
30
 31
31
 32
32
 33
33
 34
34
 35
35
 36
36
 37
37
 38
38
 39
39
 40
40
 41
41
 42
42
 43
43
 44
44
 45
45
 46
46
 47
47
 48
48
 49
49
 50
50
 51
51
 52
52
 53
53
 54
54
 55
55
 56
56
 57
57
 58
58
 59
59
 60
60
 61
61
 62
62
 63
63
 64
64
 65
65
 66
66
 67
67
 68
68
 69
69
 70
70
 71
71
 72
72
 73
73
 74
74
 75
75
 76
76
 77
77
 78
78
 79
79
 80
80
 81
81
 82
82
 83
83
 84
84
 85
85
 86
86
 87
87
 88
88
 89
89
 90
90
 91
91
 92
92
 93
93
 94
94
 95
95
 96
96
 97
97
 98
98
 99
99
 100
100
 101
101
 102
102
 103
103
 104
104
 105
105
 106
106
 107
107
 108
108
 109
109
 110
110
 111
111
 112
112
 113
113
 114
114
 115
115
 116
116
 117
117
 118
118
 119
119
 120
120
 121
121
 122
122
 123
123
 124
124
 125
125
 126
126
 127
127
 128
128
 129
129
 130
130
 131
131
 132
132
 133
133
 134
134
 135
135
 136
136
 137
137
 138
138
 139
139
 140
140